Wellinks is a wearable health technology company dedicated to improving clinical outcomes through education and creation of good habits around treatment. We use evidence-based behavioral interventions to help people get better faster. When your treatment doesn’t just end at the doctor’s office, we help you keep track of how you’re doing and stay motivated.
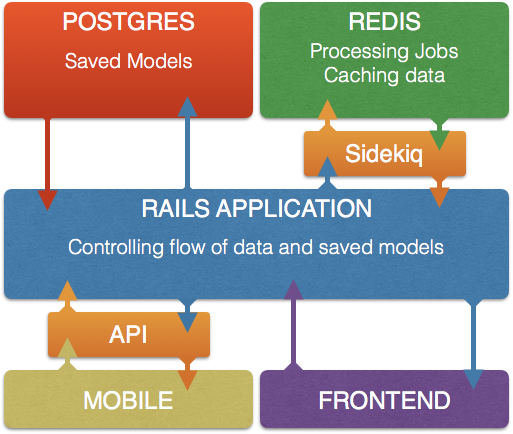
In the Cinch application logic there’s an API controller that data is routed to via outside POST requests, and JSON is returned (look for more details regarding the API or serialized JSON). There’s also the short term key/value store saved to redis as either cached data, or queues of asynchronous data to be processed before being saved to the postgres database — for example, sensor data needs to be processed into dailysummaries.
- The first tier is the data tier which uses postgres for long-term data, redis for short-term or transient data.
- The core of the logic is done in the controller code within the rails application, processing the flow between the 1st and 3rd layers.
- The user interacts at the third tier – whether via the website views or a mobile application utilizing the API interaction.

Databases
The main database is a Postgres DB which is a SQL (Structured Query Language) database, allowing database requests by both Ruby on Rails’ ActiveRecord class syntax as well as more granular interaction bypassing ActiveRecord by the standard database request queries (ie MySQL).
Redis, a secondary, less permanent database utilizing a key/value file store is used for an asynchronous task-based queuing system. Think of this as short-term memory to the Postgres DB’s long term memory. Redis is used for numerous small helper tasks — Sidekiq processing of synced SensorEvent data sent from the devices into saved DailySummaries into the Postgres DB or even smaller pieces of cached JSON data into the saved filestore layer to speed up API communication and ease up on database queries.
User Facing
A basic Bootstrap framework is being used for the front end of the website, with any charting being displayed by using DC.js which is like D3.js but with the added use of the crossfilterframework for filtering of records loaded via JSON requests and serialization.

